A Kinetics Analyzing Tool

Latest version: 1.0.0, updated at 2021-11-10
1. Overview
1.1 About py.Kinetics
py.Kinetics is an open-source Python software for kinetics analyses, designed for UNISOKU laser flash photolysis measurements on Mac computers. We created this program to solve the problem that the official UNISOKU S&K (kinetics analyzing software) could only be run on Windows PC.
py.Kinetics is developed with Python 3.9.6, thus, users can run py.Kinetics through Python IDE. It can be freely download from the GitHub page. The source code, executable file for macOS could be found for the latest release.
1.2 How It Works
py.Kinetics reads transient absorption data from a .csv file. Since the program is designed for UNISOKU spectrometer, a .hdr file which has a same file name with .csv file is also needed to read time unit.
1.3 Testing Platform
py.Kinetics has been test on following platform:
- MacBook Pro (M1 Pro, 2021), macOS 12.0.1
- Mac mini (i5-8500B, 2018), macOS 12.0.1
- Intel CoreTM i7-10700 PC, Microsoft Windows 11 Education (Source code mode)
2. Install
2.1 Run with Source Code
If Python IDE is installed, py.Kinetics could be run from the source code. Python 3.7+ is recommended. You can download the latest version of Python from homepage. py.Kinetics is running with external library matplotlib, numpy, scipy and Pillow, please make sure all of these lib are installed on your computer before running py.Kinetics.
2.2 Run with Executable File
2.2.1 Use Pre-packaged Executable File
Executable file for macOS is pre-packaged. Download the executable file from here and save it in the /Applications folder, and you can run py.Kinetics from Launchpad.
2.2.2 Common Issues
If the packaged programs cannot work due to system security problem, please refer to the following methods.
If warning window: “Cannot open an app from an unidentified developer” showed up when you run packaged executable file, please go to “System setting” -> “Security & Privacy” and click “Open Anyway”, click “Open”. Then, you could run the program by double click.
3. Usage
3.1 Basic of py.Kinetics
The main py.Kinetics interface is illustrated in Figure 1.
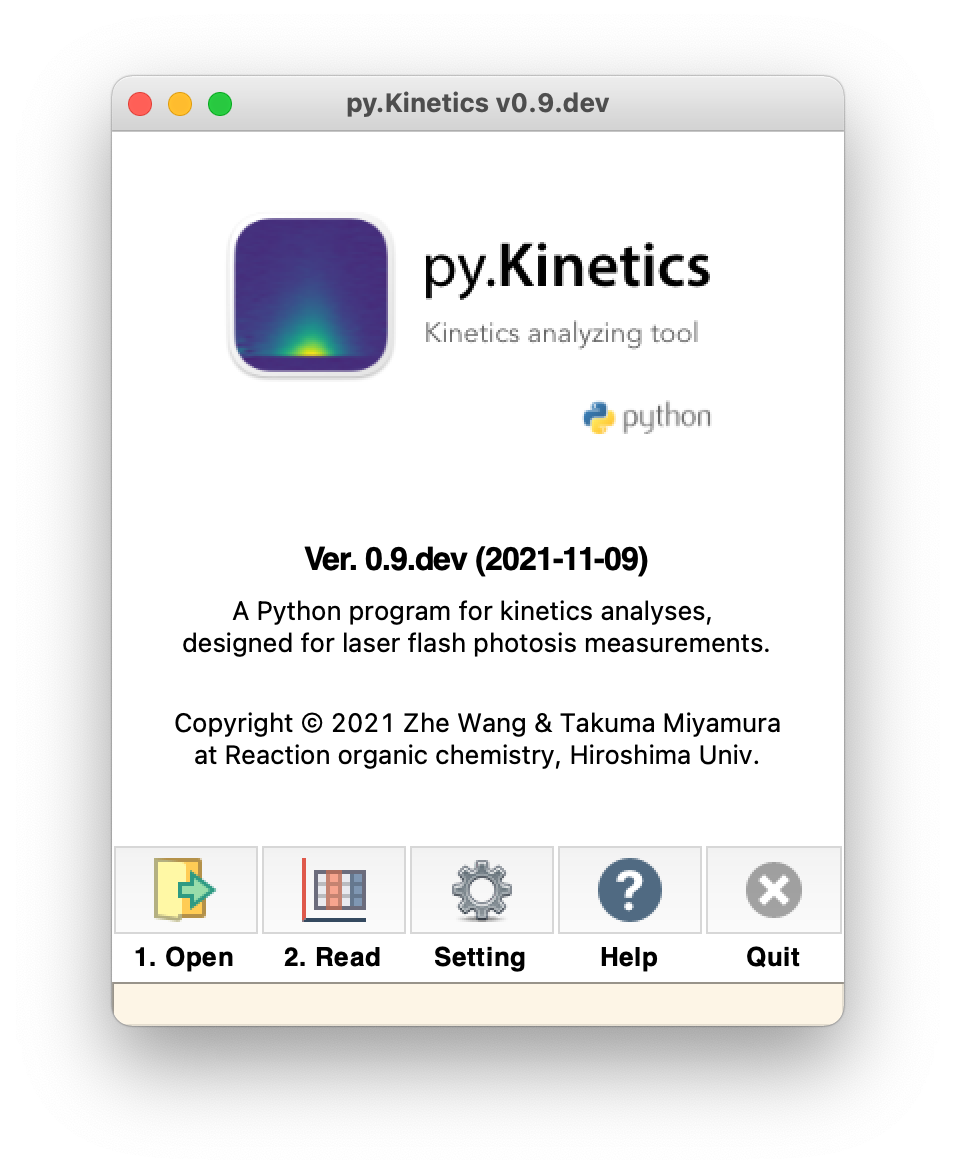
Figure 1. Main window of py.Kinetics
It consists of these main components:
![]() Open: Click on this button will bring up an Open file dialog. User can open a .csv file. The file name would be displayed in the bottom orange bar.
Open: Click on this button will bring up an Open file dialog. User can open a .csv file. The file name would be displayed in the bottom orange bar.
![]() Read: Plot the data from specified .csv file. A .hdr file is also needed to read time unit, if the .hdr file does not exist, a warning window (Figure 2) will show up and nanosecond ‘ns’ will be used for the time unit.
Read: Plot the data from specified .csv file. A .hdr file is also needed to read time unit, if the .hdr file does not exist, a warning window (Figure 2) will show up and nanosecond ‘ns’ will be used for the time unit.
![]() Setting: Open the setting panel, see section 3.4.
Setting: Open the setting panel, see section 3.4.
![]() Help: Jump to the homepage of py.Kinetics with an online version of user manual.
Help: Jump to the homepage of py.Kinetics with an online version of user manual.
![]() Quit: Terminate the whole program. Quit the py.Kinetics by this button is recommended. Users do not need to close all active windows before quitting the py.Kinetics.
Quit: Terminate the whole program. Quit the py.Kinetics by this button is recommended. Users do not need to close all active windows before quitting the py.Kinetics.
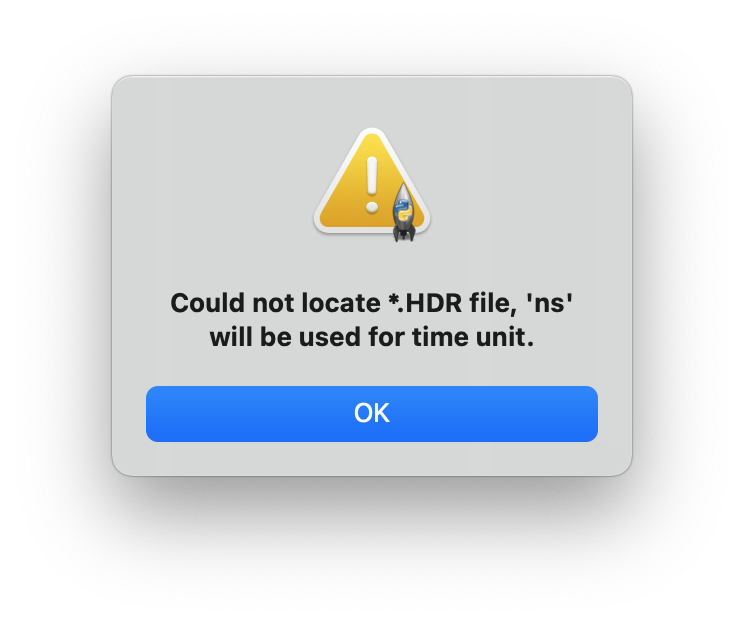
Figure 2. Warning window if .hdr file does not exist
3.2 Working with Transient Absorption Spectrum
If a multi-wavelength transient absorption data is read, 3D view plot will be displayed in a new window (Figure 3). If the .csv file is monochromic data, only time trace plot will be displayed (Figure 6, left).
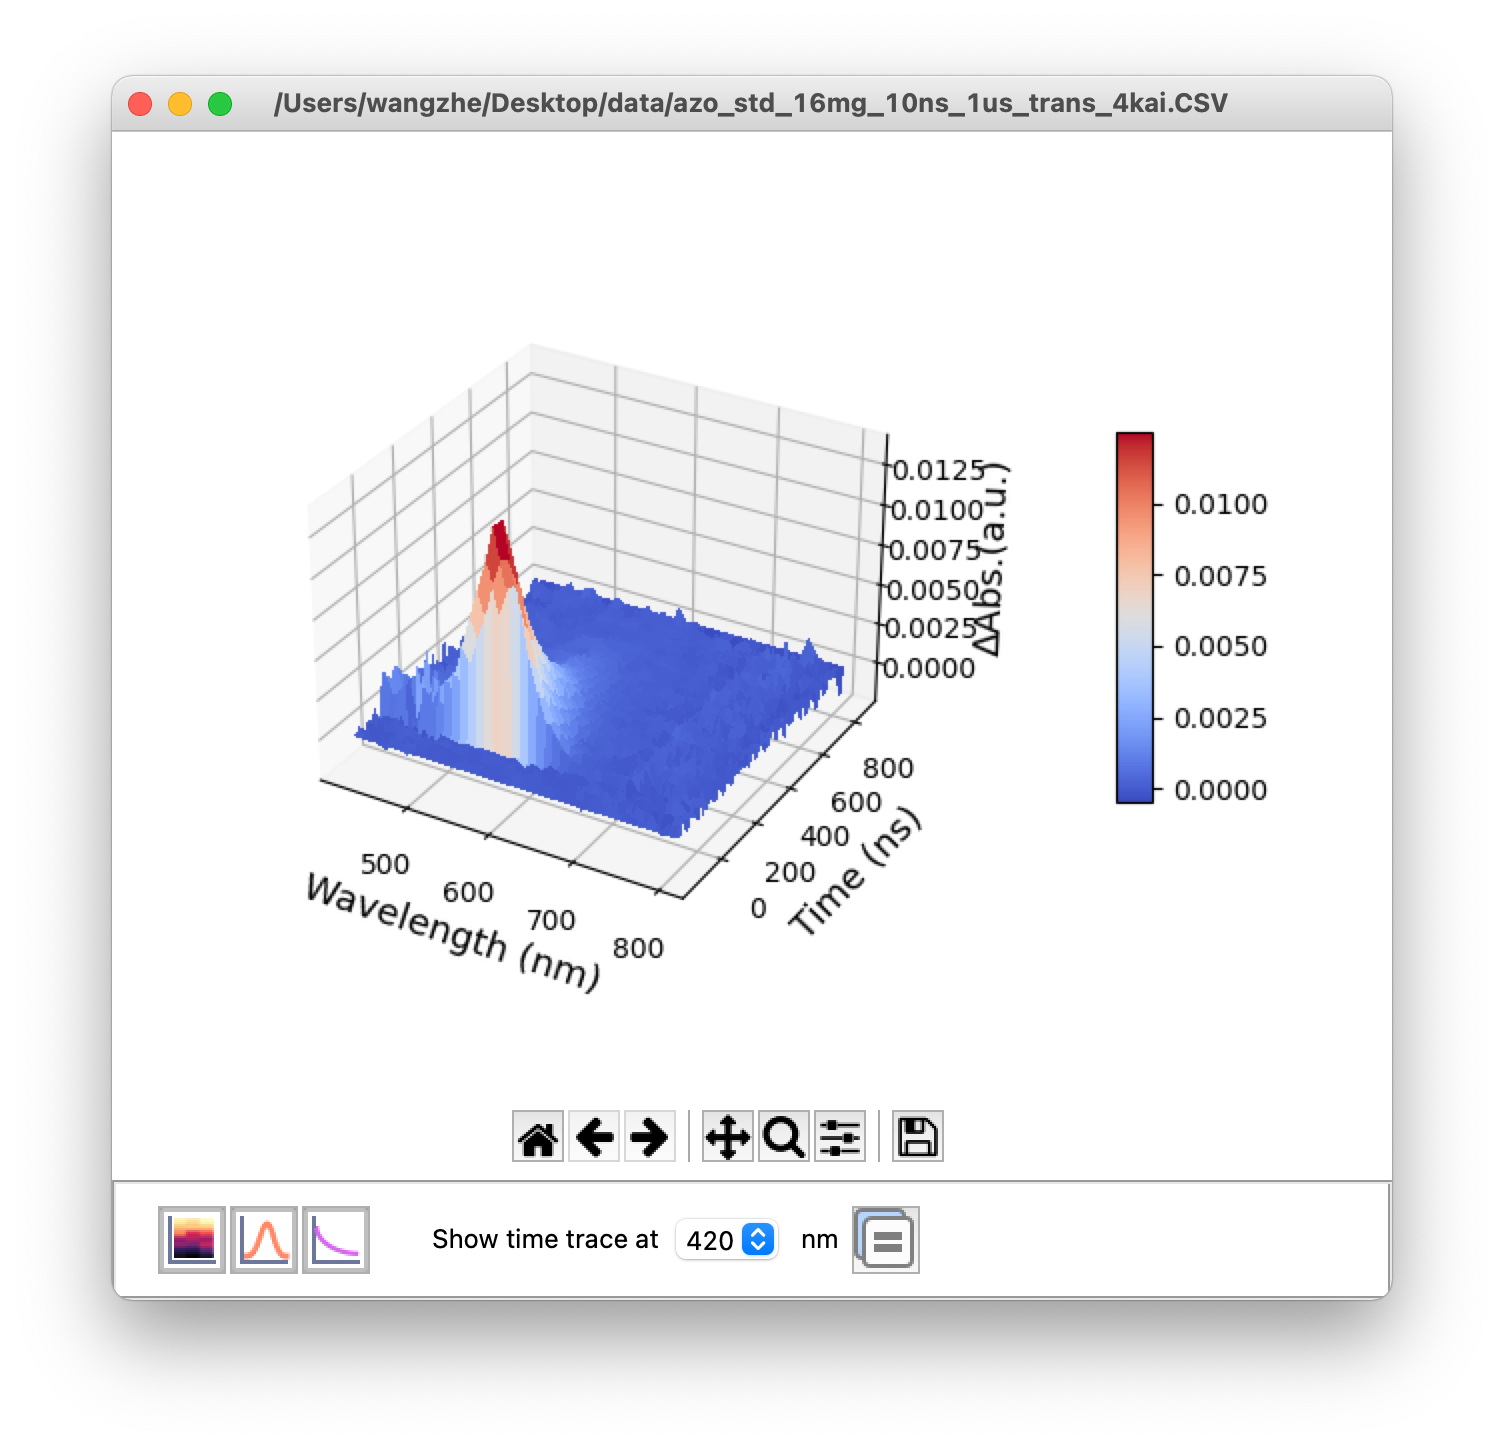
Figure 3. 3D view window of a transient absorption spectra data
Basic functions in 3D-view window:
![]() Heatmap: Show the heatmap in a new window.
Heatmap: Show the heatmap in a new window.
![]() TAS: Show 2D transient absorption spectrum in a new window.
TAS: Show 2D transient absorption spectrum in a new window.
![]() TAS in time trace: Show time traces in a new window.
TAS in time trace: Show time traces in a new window.
 Time trace of single wavelength: Show time trace at a single wavelength in a new window, select the wavelength from the list box.
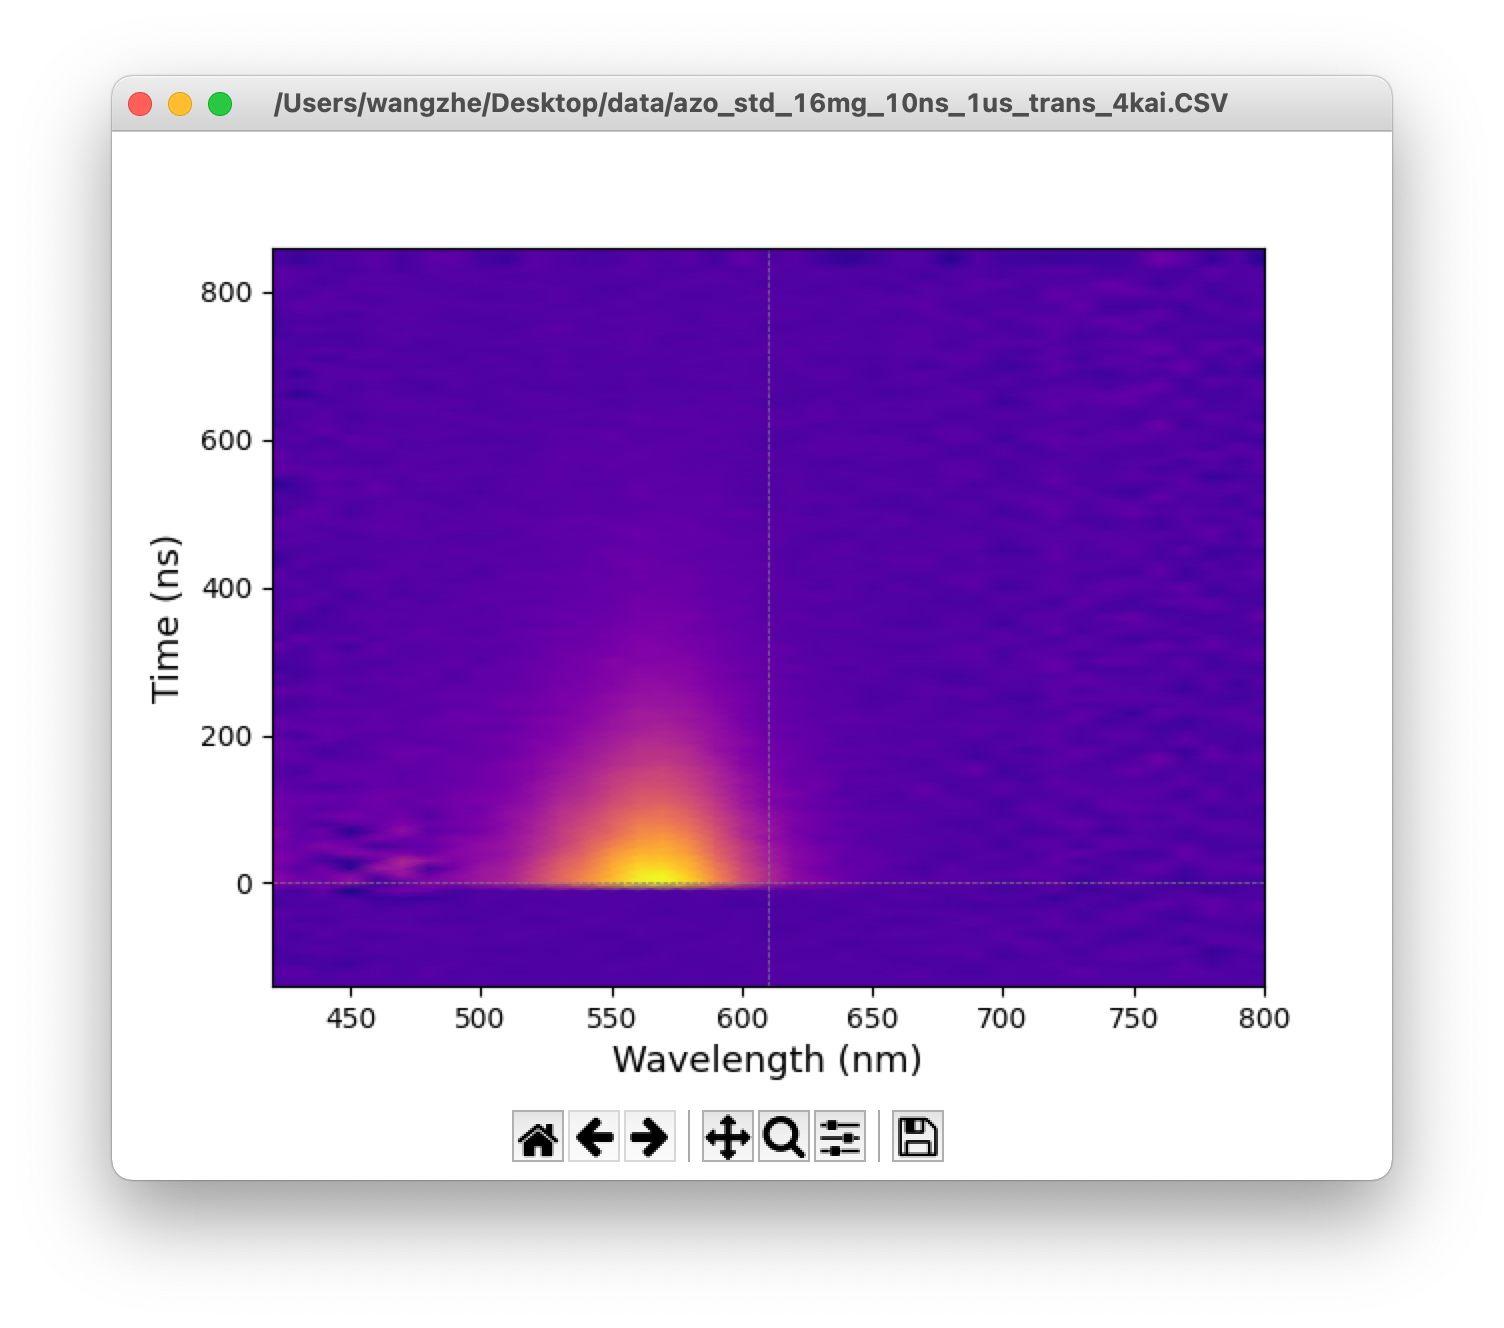
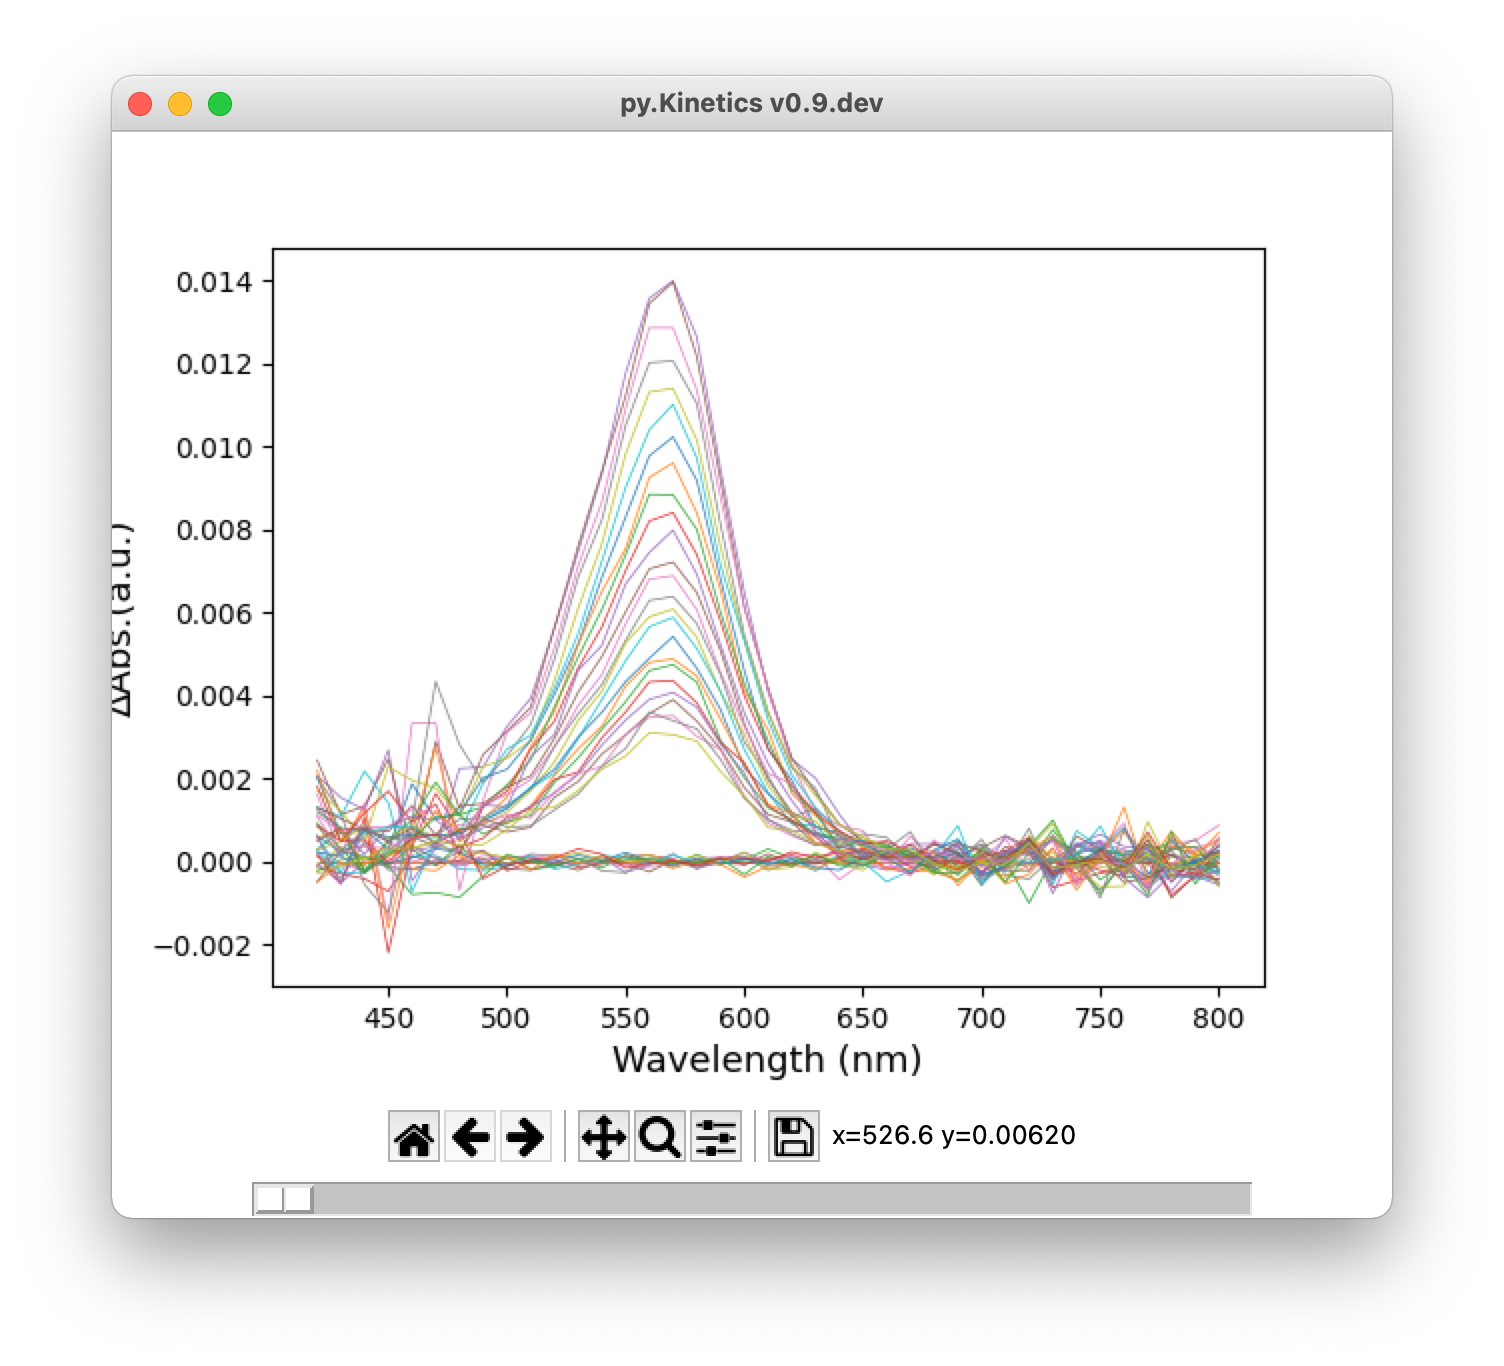
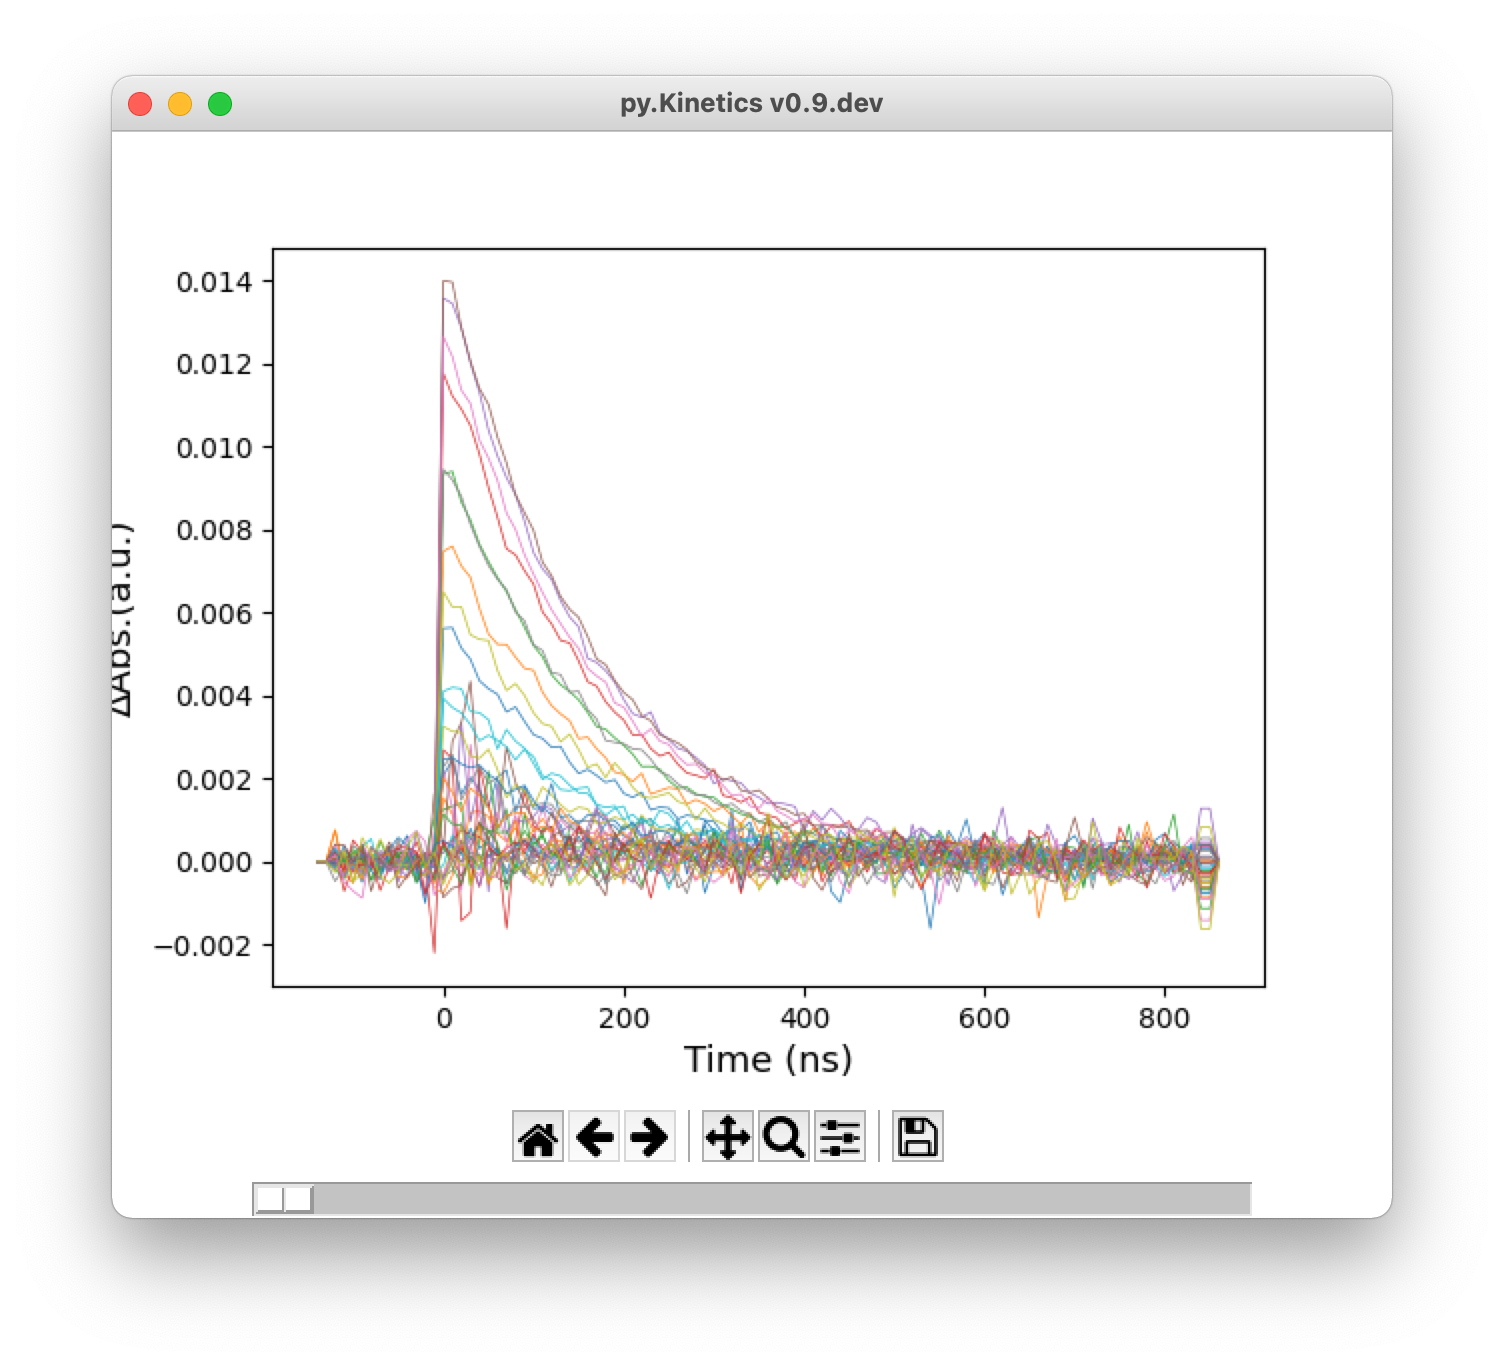
Figure 4. From top: heatmap, 2D transient absorption spectrum, time traces
For 2D transient absorption spectrum and time traces, user can highlight a single curve by the slider at the bottom of the window (Figure 5).
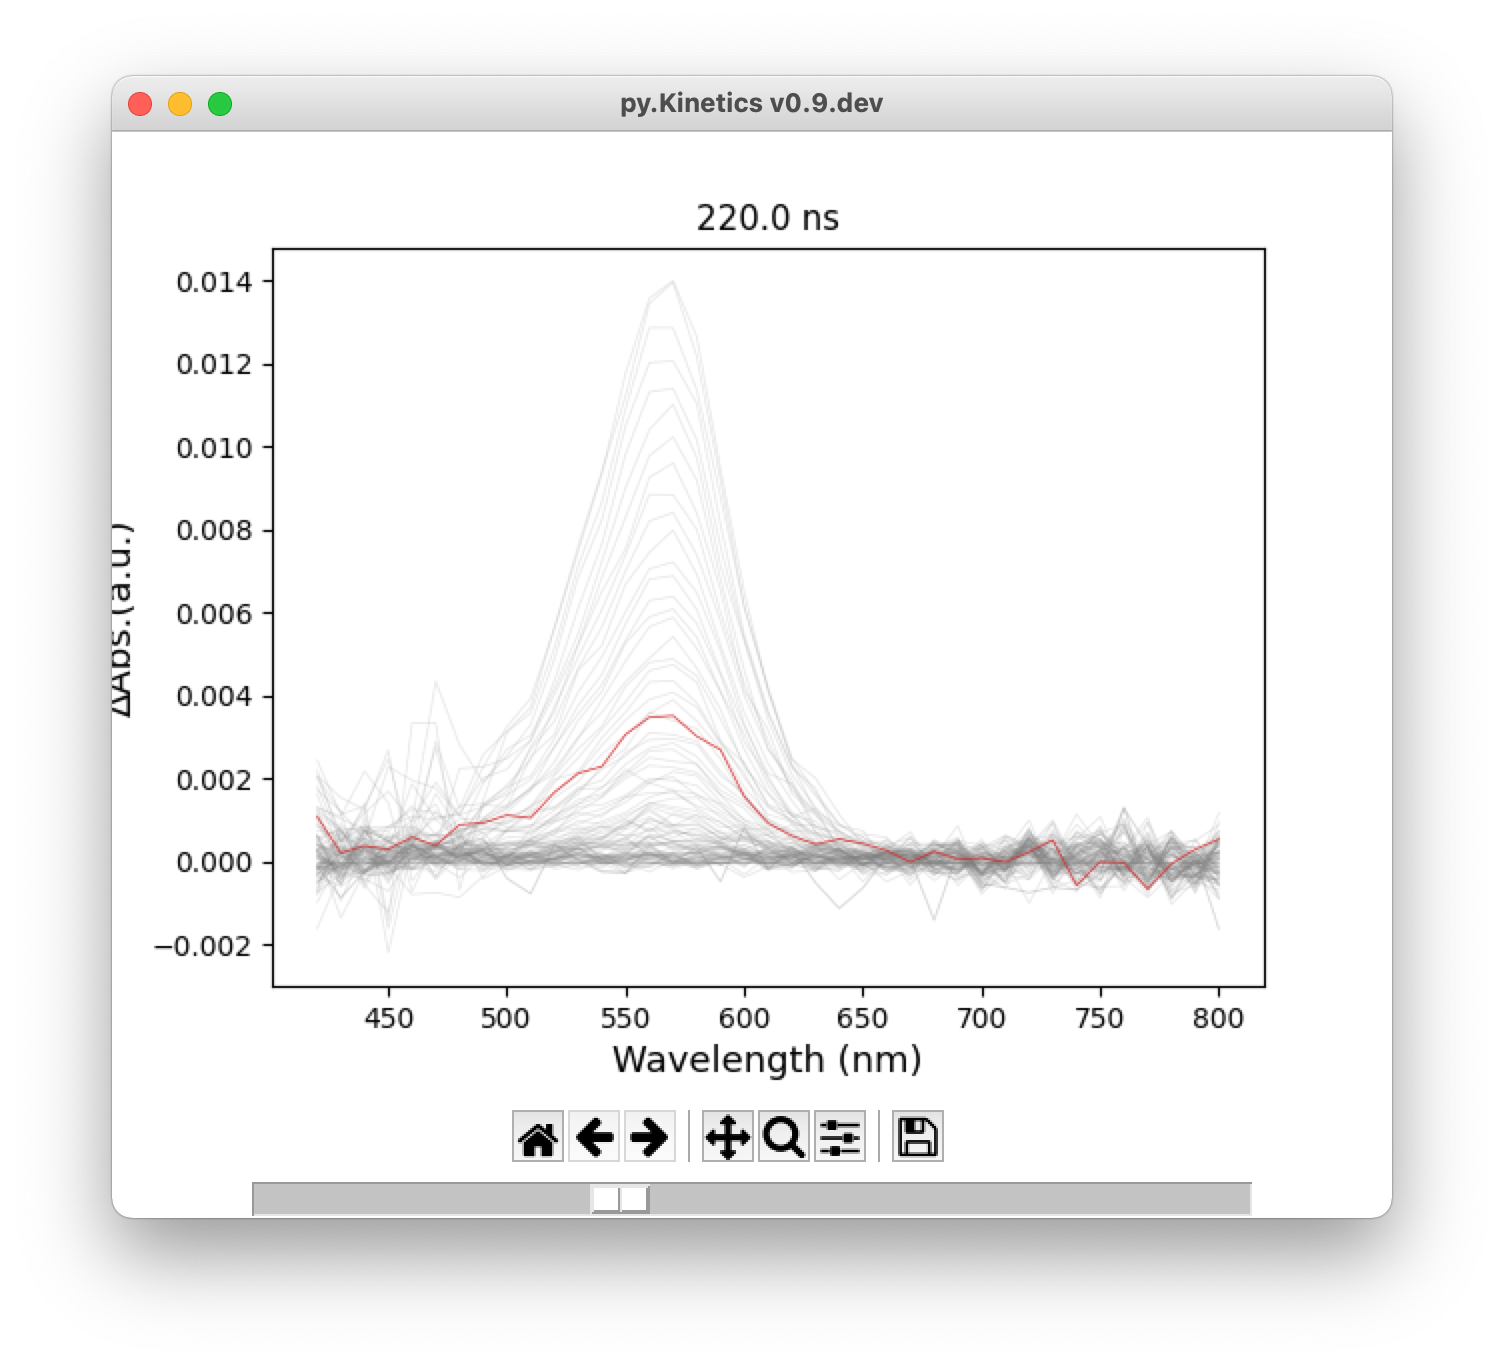
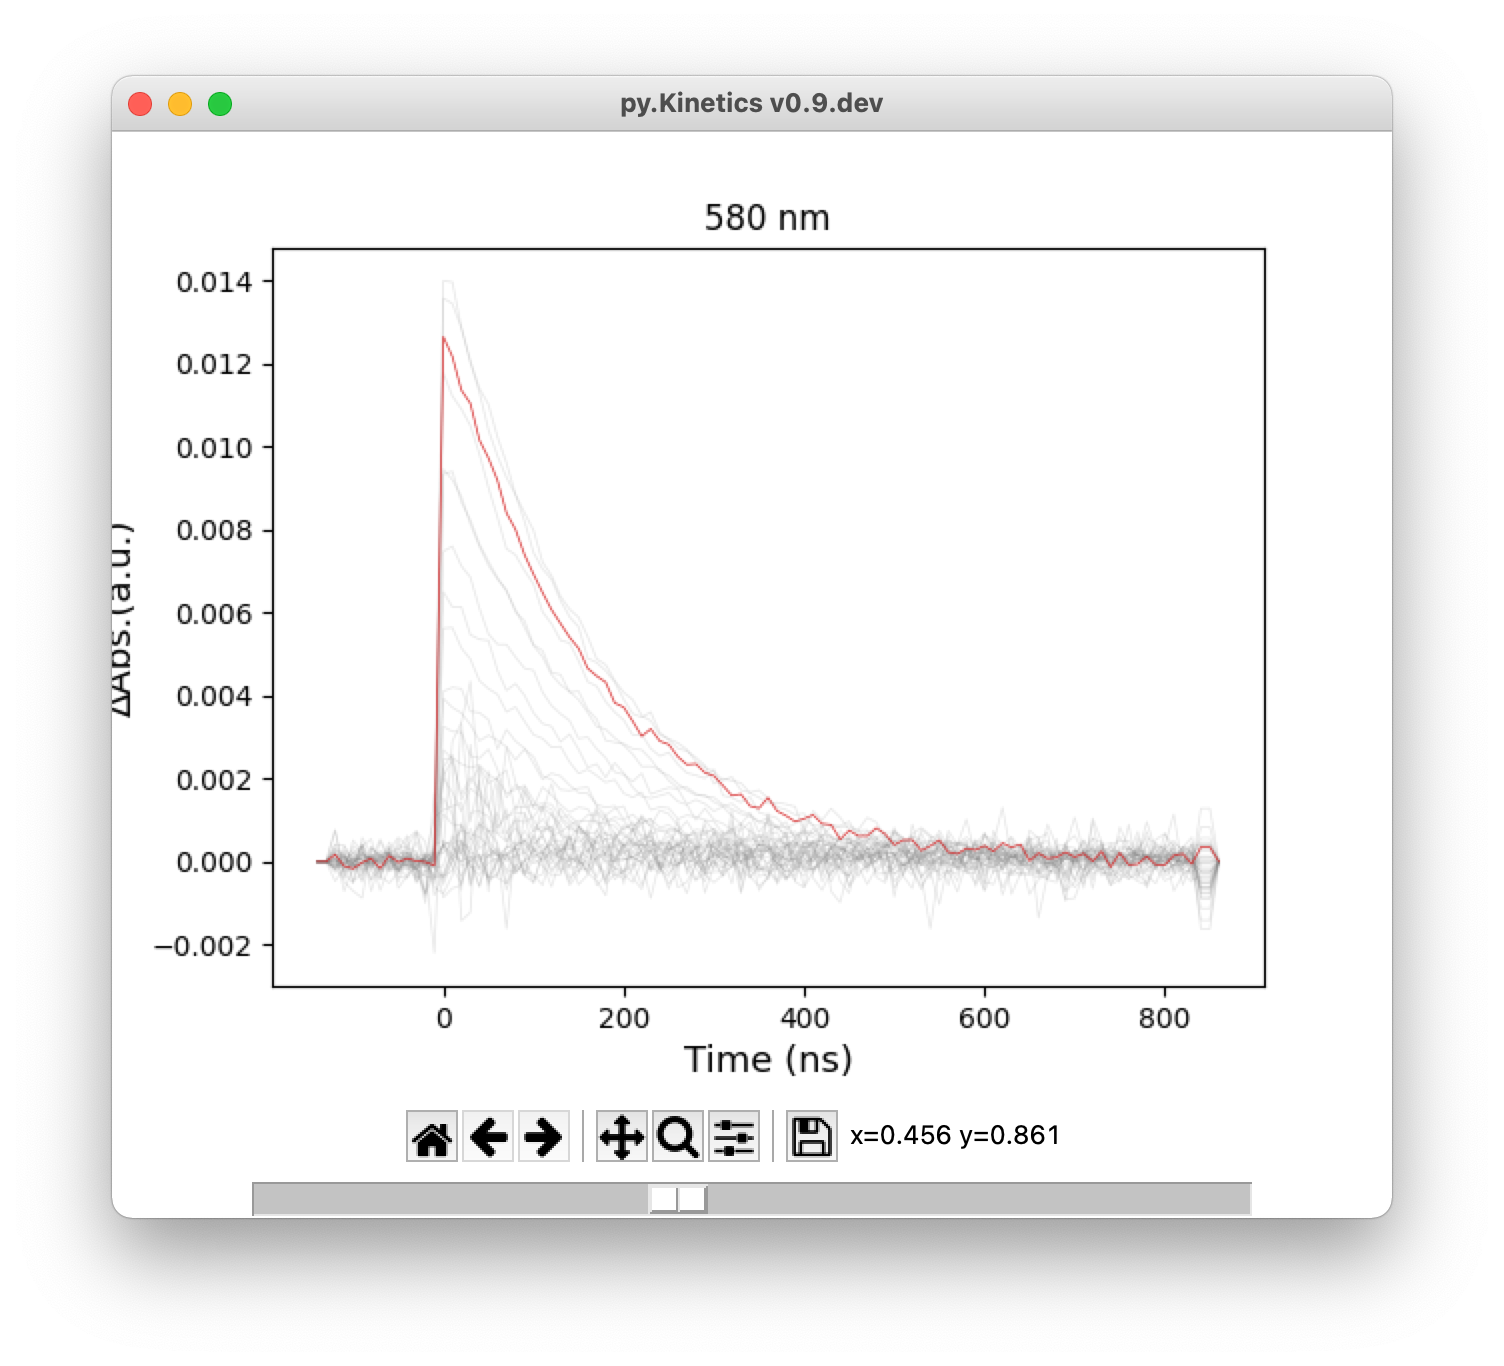
Figure 5. Highlight a single curve using slider
3.3 Exponential Fitting
py.Kinetics have 3 built-in exponential fitting model:
Single exponential decay: ![]()
Second-order exponential decay: ![]()
Third-order exponential decay: ![]()
In the time trace window, the fitting buttons are displayed at the bottom. To fitting a time trace, first users need to set the fitting region by specify the initial (red) and ending (green) lines using left and right click on the mouse, respectively. Then, click the fitting button will bring out the fitting result in a new window. The original data line, fitting line and difference line will be showed up. The fitted parameters will also be displayed on the screen (Figure 6). Initial guess of line fitting could be customized from setting panel (Section 3.4).
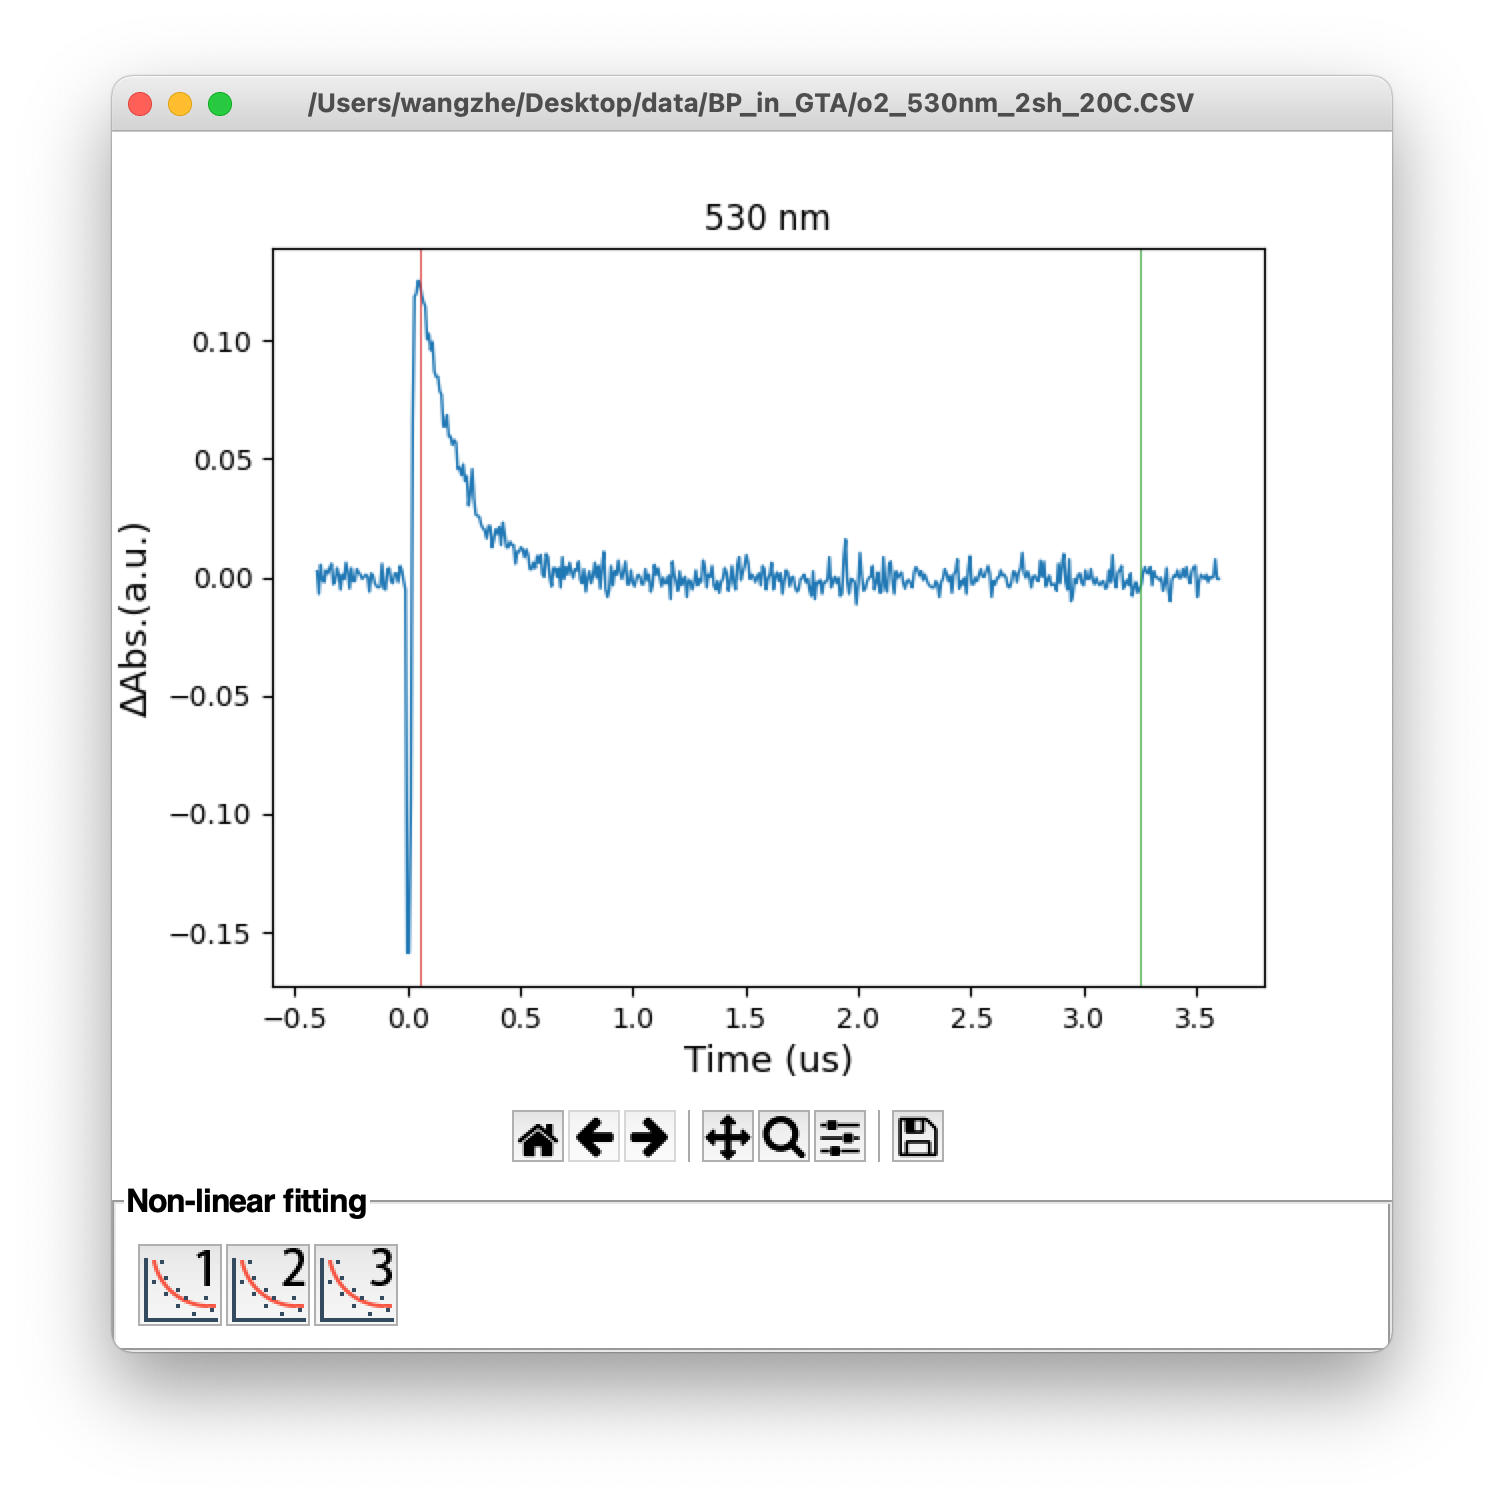
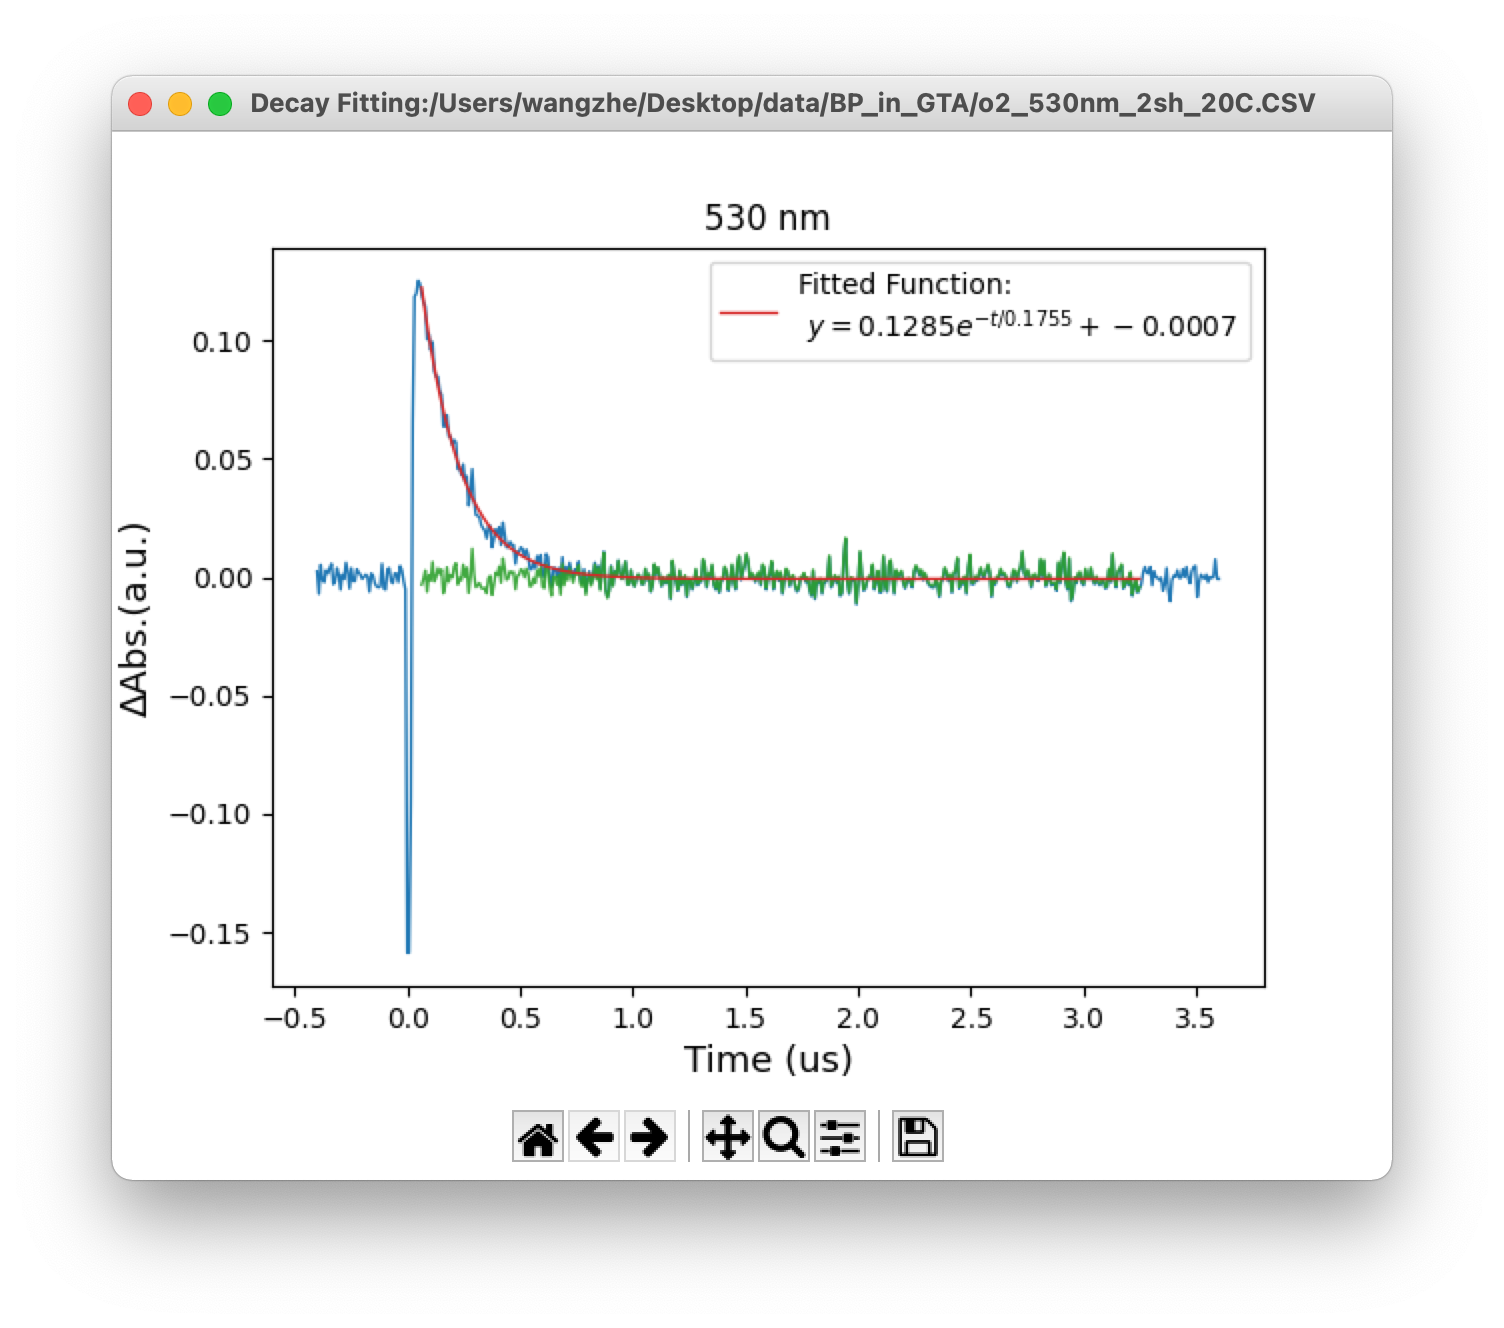
Figure 6. (Top) Monochromic time trace, (bottom) line fitting window
3.4 The Program Setting Panel
The program setting panel could be accessed from the main window. Users can customize the plot style and initial guess of line fitting (Figure 7). After setting the program parameters, click the “OK” button to save the changed parameters.
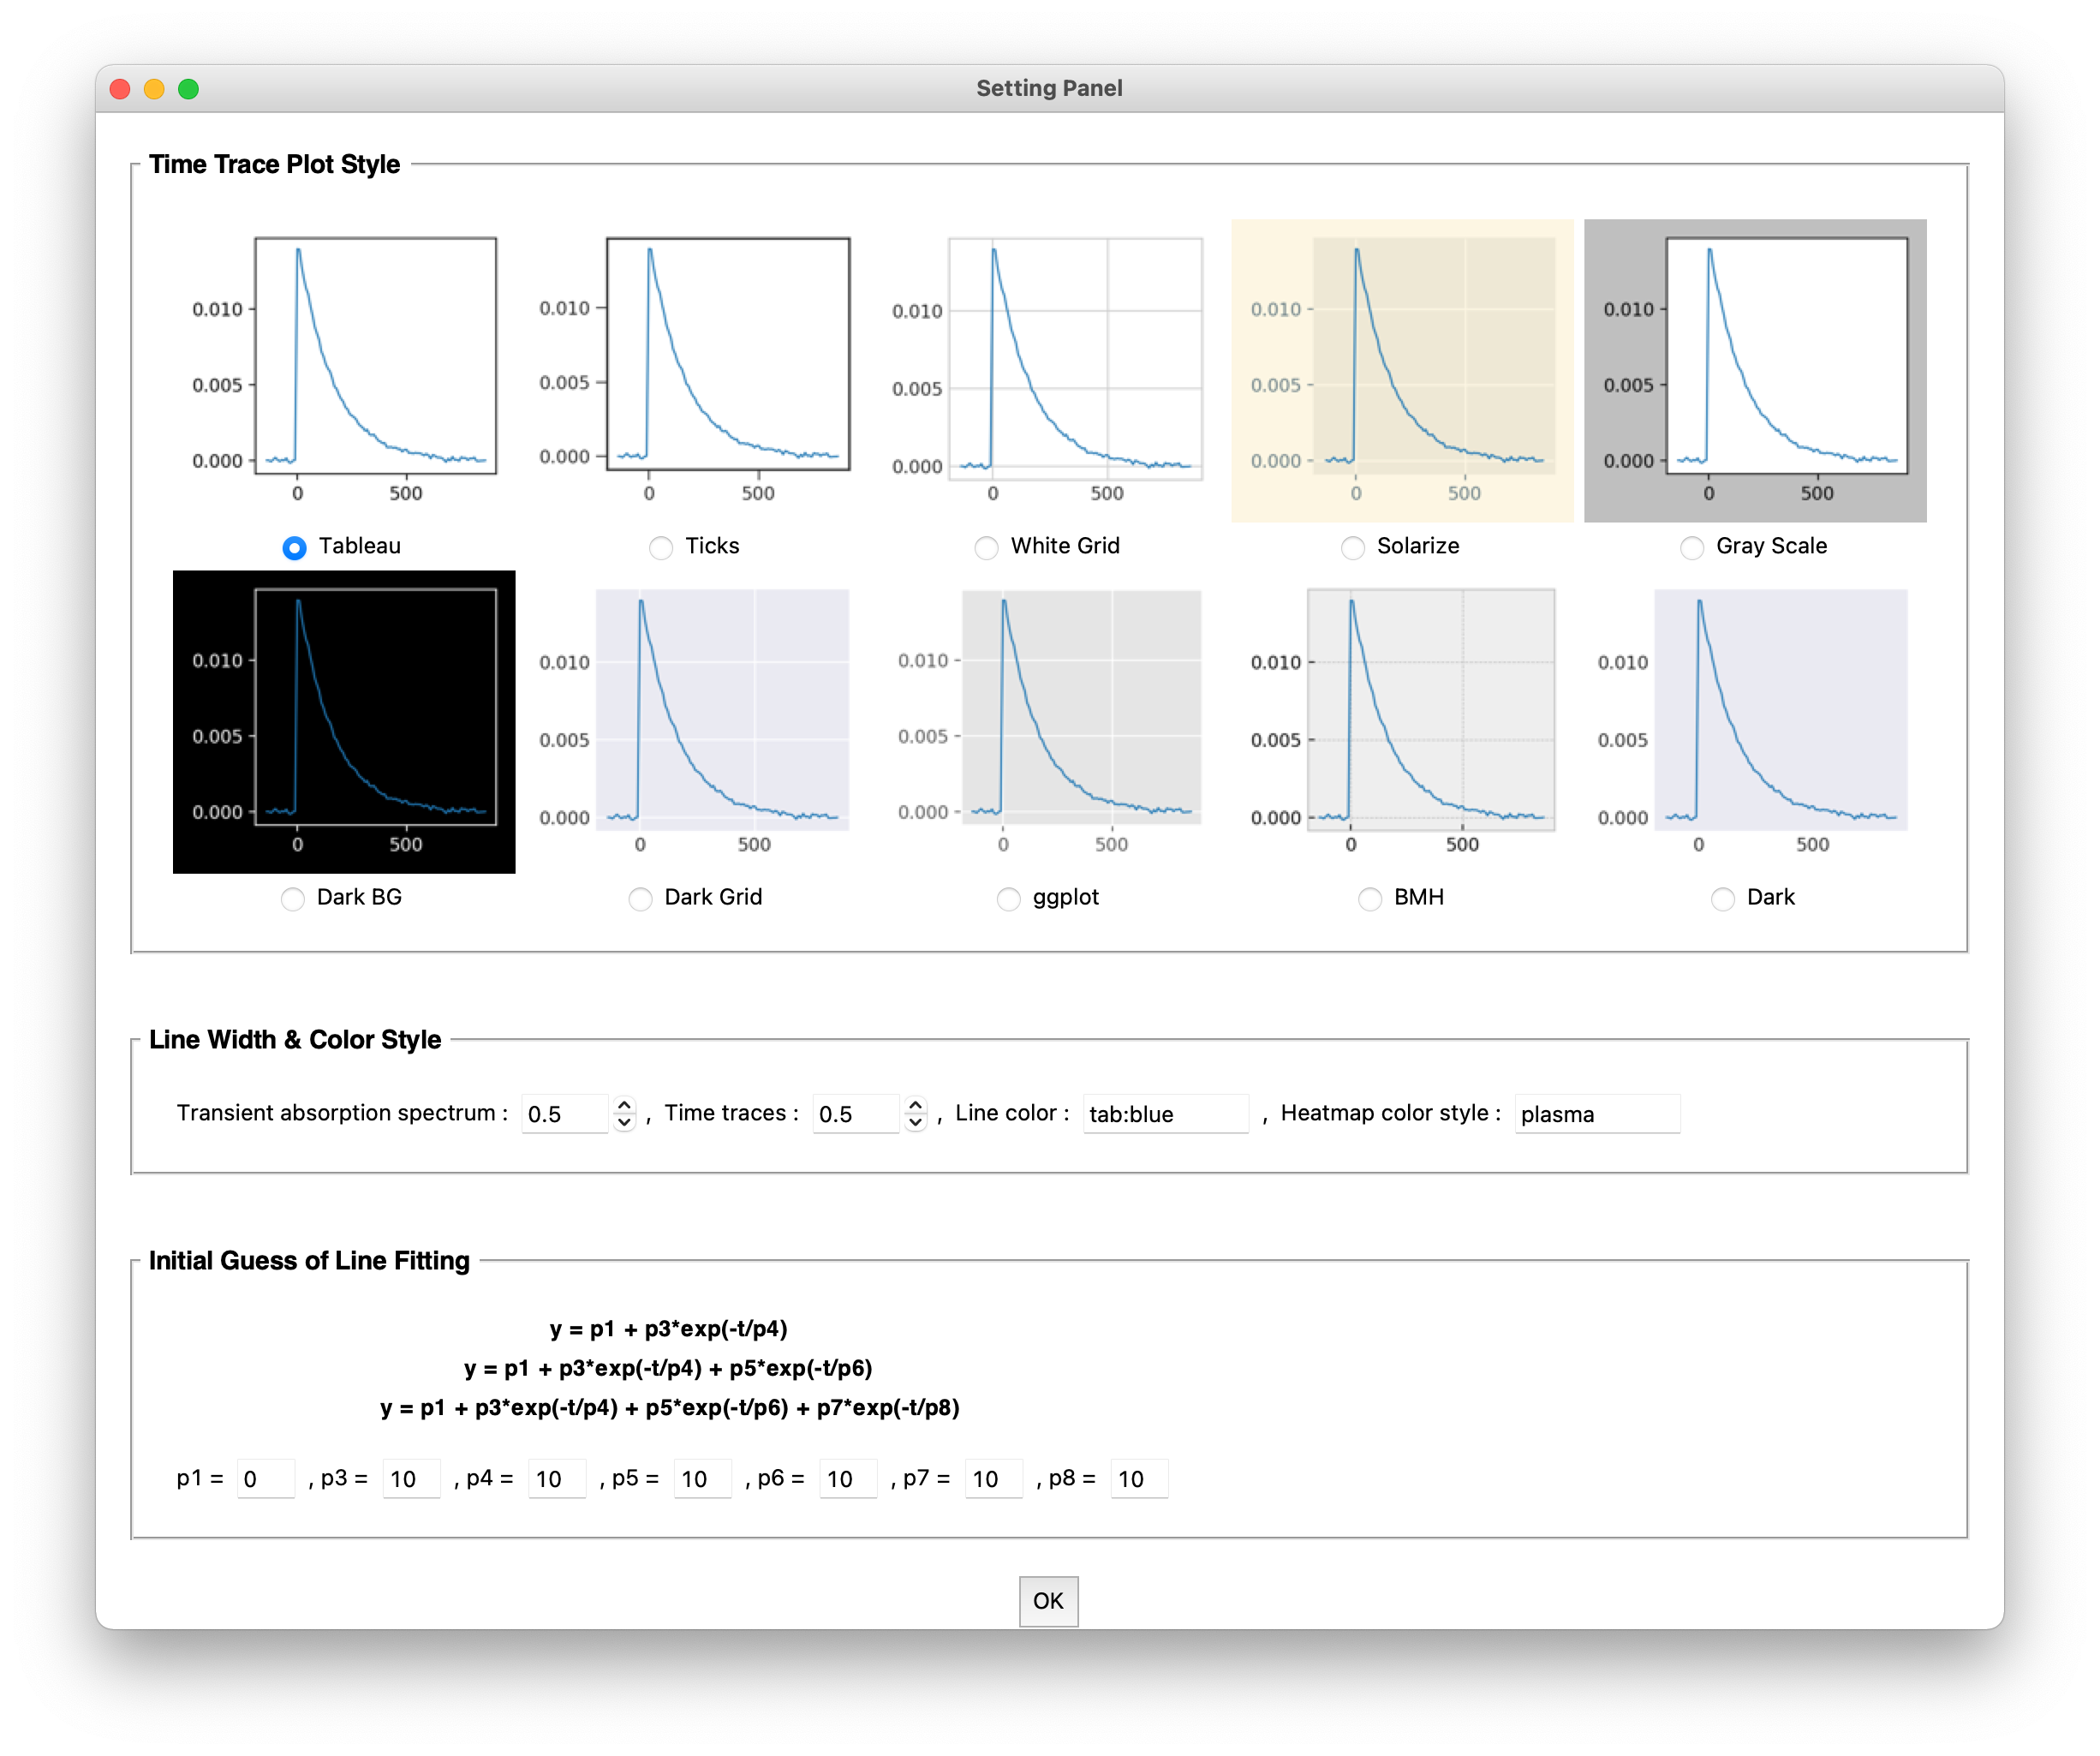
Figure 7. Setting panel window of py.Kinetics
3.4.1 Time Trace Plot Style
Users can choose a plot style for the time trace from 10 plot styles. The default style is Tableau.
3.4.2 Line Width & Color Style
Line width option is available for transient absorption and time traces plots, users can choose a value in the range from 0.5 to 5.0, with 0.5 step size. The default line width value is 0.5 (Figure 8). Line color and heatmap color map are supported by matplotlib color system. Users can use all colors and colormap those allowed by matplotlib. For more information, please refer to the Appendix and matplotlib documents. The default line color is tab:blue and default colormap is plasma.
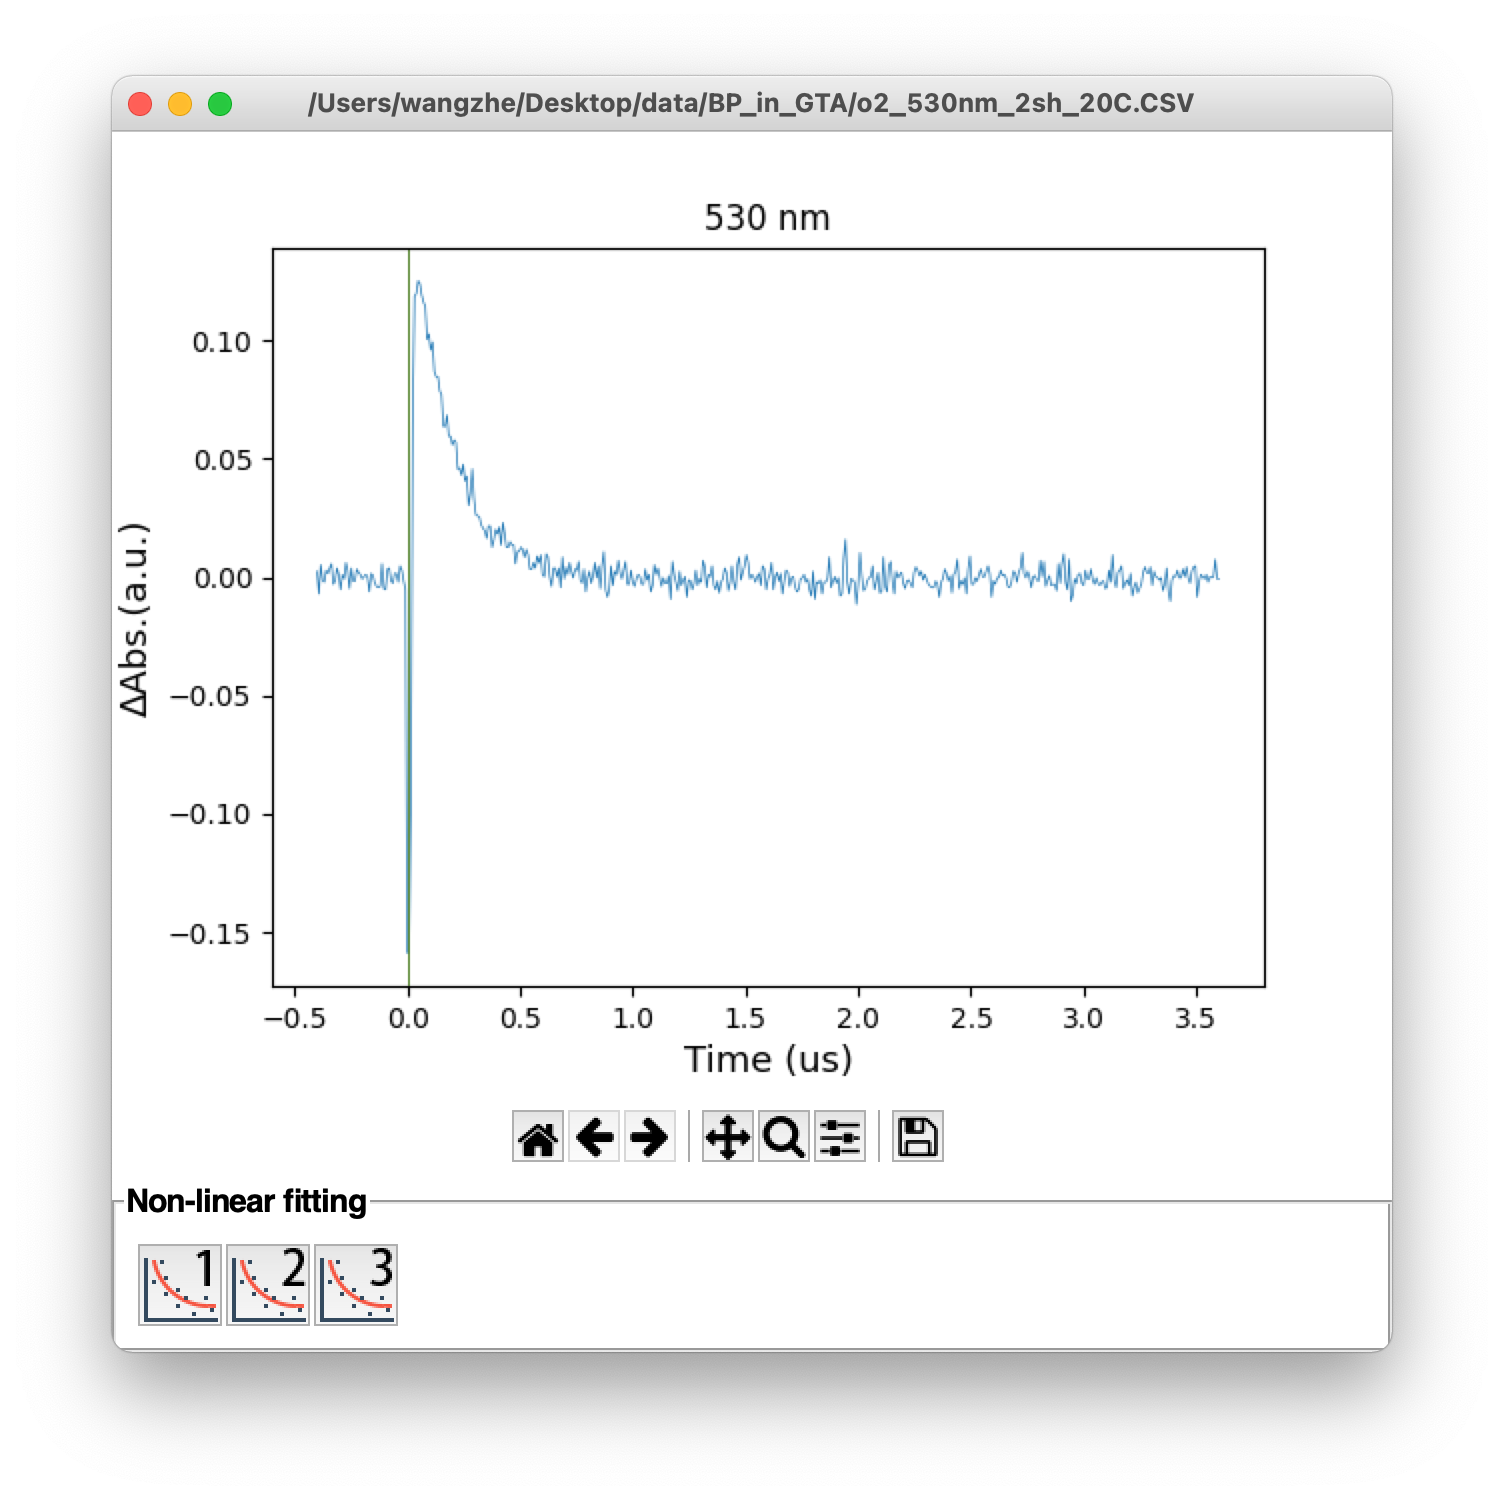
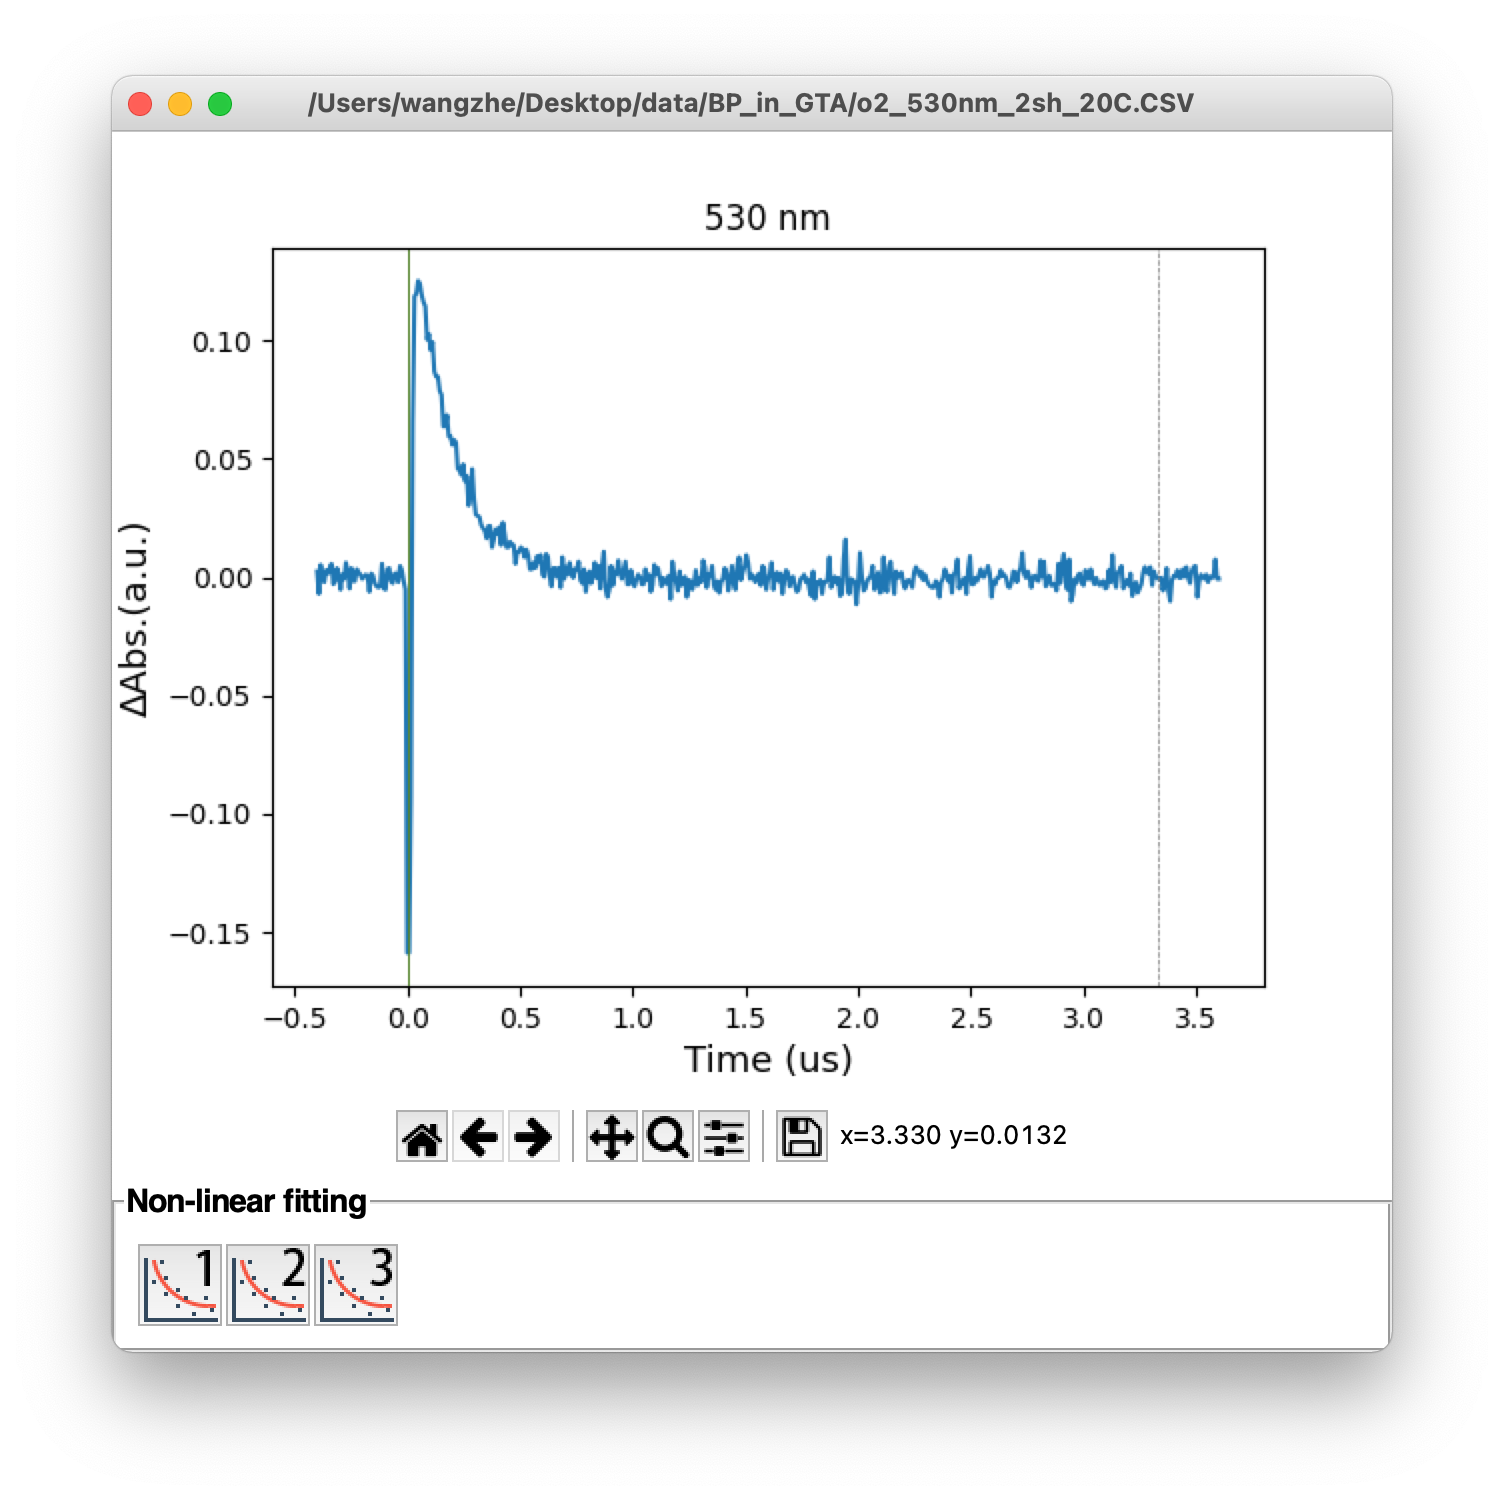
Figure 8. Time traces with different line width: 0.5 (top) and 1.5 (bottom)
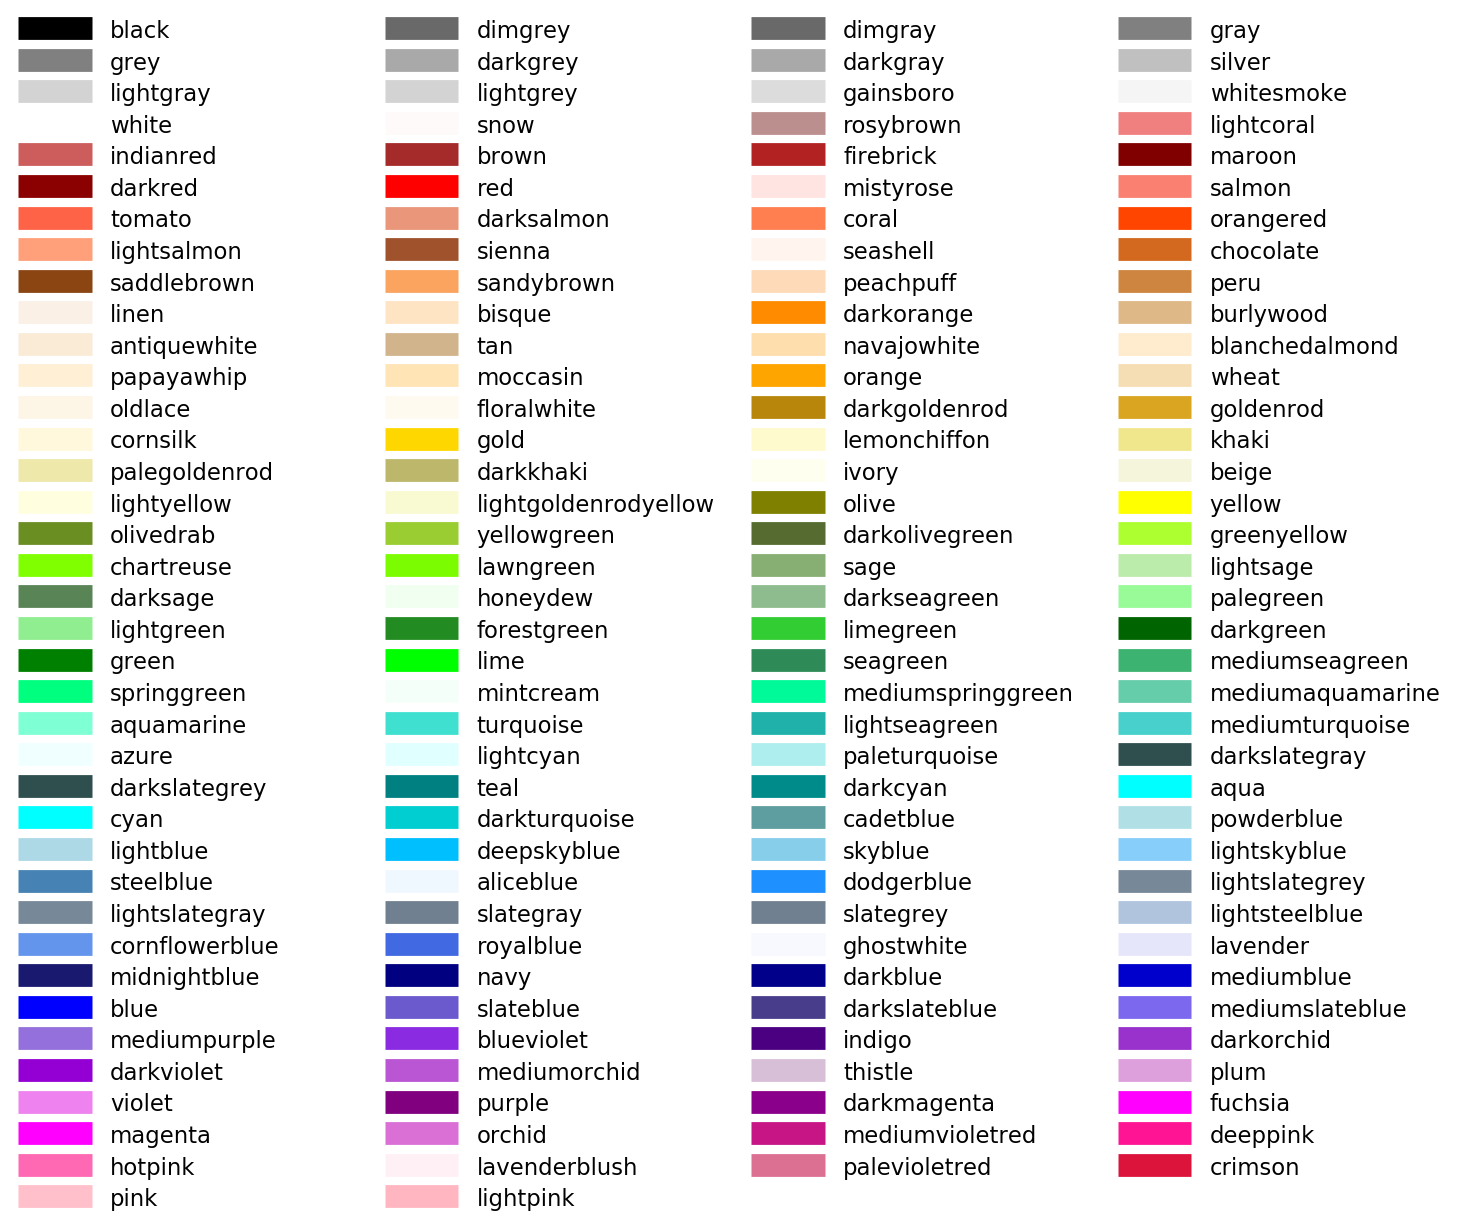
Appendix I Line Color
1. Use color name colorpalette
Matplotlib has several built-in colors, users can use these colors by inputting the color name directly.
2. Use single character
The following eight major colors can be specified with a single character, consisting of the three primary colors of light (RGB), the three primary colors of color (CMY), and black and white (KW).

3. Use HEX color codes
Matplotlib allows users to use hexadecimal number those used in HTML and CSS, such as #ff0000 (red), #000000 (black). Here are some examples:

4. Use greyscale
Color can also be specified in a grayscale from 0.0 (black) to 1.0 (white).

Although RGB code (e.g.:
[1.0 0.5 0.0]) is supported by matplotlib for color specifying, but due to variable type problem, RGB code is not allowed in py.Kinetics.
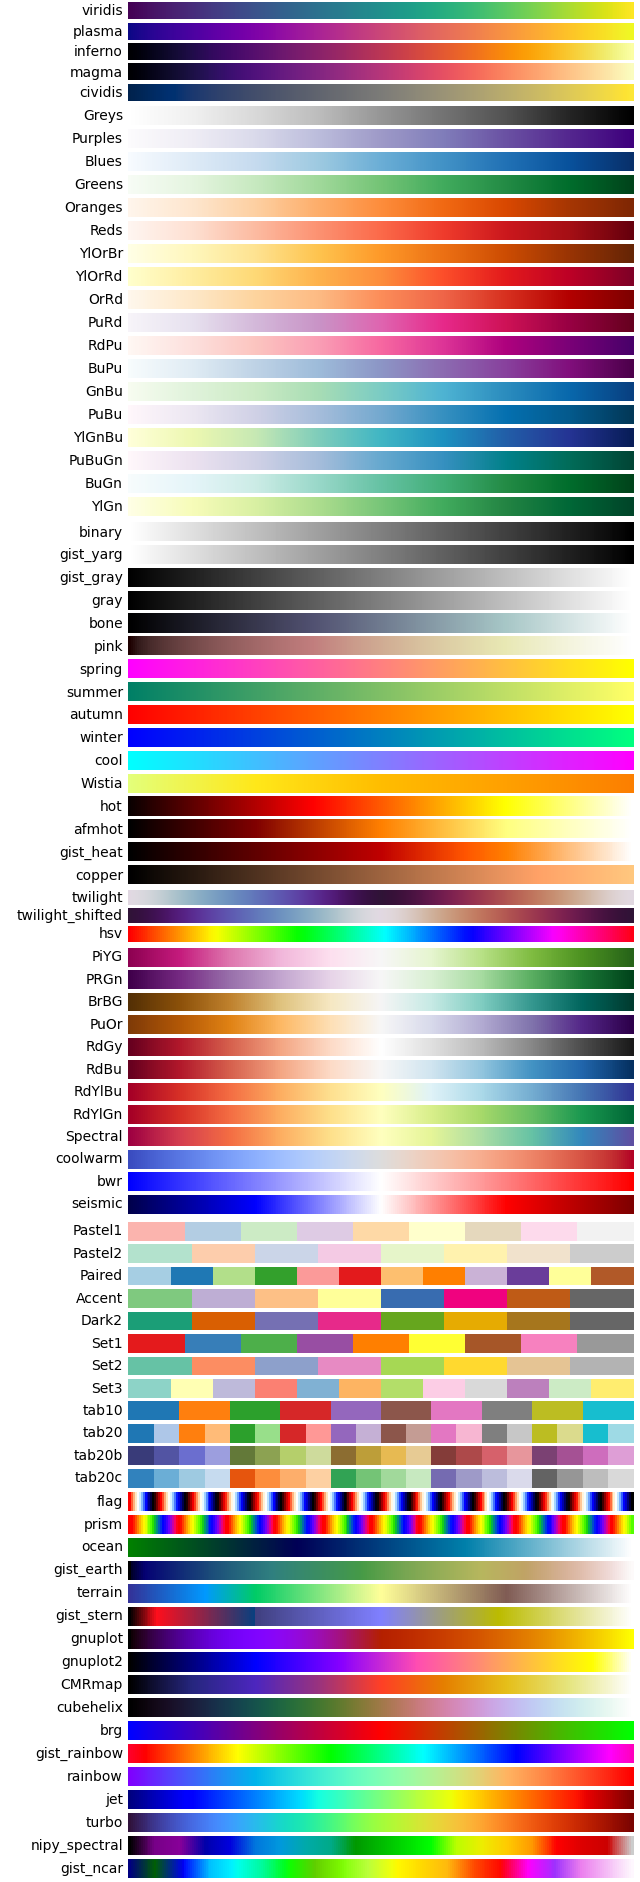
Appendix II Colormap
Matplotlib has plenty of built-in colormaps. In py.Kinetics, users can easily access these colormap by colormap code. All available colormap are listed following.
LICENSE
py.Kinetics is following MIT license. The LICENSE file could be found along with py.Kinetics source code.
MIT License
Copyright (c) 2021 Zhe Wang & Takuma Miyamura
Permission is hereby granted, free of charge, to any person obtaining
a copy of this software and associated documentation files (the "Sof-
tware"), to deal in the Software without restriction, including with-
out limitation the rights to use, copy, modify, merge, publish, dist-
ribute, sublicense, and/or sell copies of the Software, and to permit
persons to whom the Software is furnished to do so, subject to the f-
ollowing conditions:
The above copyright notice and this permission notice shall be inclu-
ded in all copies or substantial portions of the Software.
THE SOFTWARE IS PROVIDED "AS IS", WITHOUT WARRANTY OF ANY KIND, EXPR-
ESS OR IMPLIED, INCLUDING BUT NOT LIMITED TO THE WARRANTIES OF MERCH-
ANTABILITY, FITNESS FOR A PARTICULAR PURPOSE AND NONINFRINGEMENT. IN
NO EVENT SHALL THE AUTHORS OR COPYRIGHT HOLDERS BE LIABLE FOR ANY CL-
AIM, DAMAGES OR OTHER LIABILITY, WHETHER IN AN ACTION OF CONTRACT, T-
ORT OR OTHERWISE, ARISING FROM, OUT OF OR IN CONNECTION WITH THE SOF-
TWARE OR THE USE OR OTHER DEALINGS IN THE SOFTWARE.